SSM.EXE is a graphical Win32 program that lets you acquire a succession of spectrum-analyzer display traces over time, with the option to save and replay the acquired data.
Applications include long-term stability testing, RF interference and link-quality surveys, weak-signal communications, and signal intelligence/TSCM work.
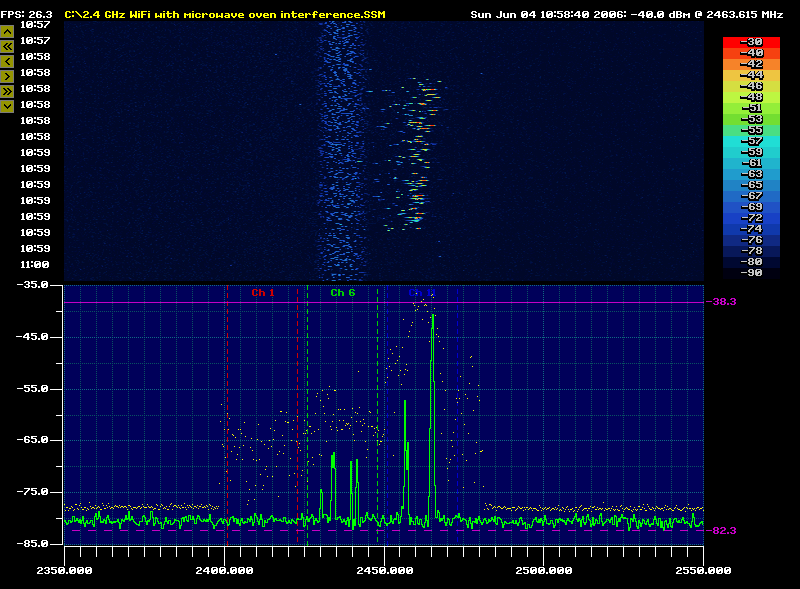
You can download a sample .SSM recording file here (10 MB). The image at right was created by scrolling through this recording with the Display->Accumulate maximum and Display->802.11 WLAN channel boundaries options enabled.
The current version of SSM supports the following spectrum analyzer models:
SSM.EXE is part of the KE5FX GPIB Toolkit. The latest version of the Toolkit is downloadable here.
Running SSM
Depending on the options you selected during installation, you can run SSM.EXE from the Start menu, by clicking on its desktop shortcut, or by using its Quick Launch icon on the taskbar.You can also run SSM.EXE from a DOS-box command line or Windows Start->Run... command, optionally specifying a GPIB address from which to acquire data, or the name of an existing .SSM file. Use quotes around filenames that contain spaces. Here are a few command-line examples that assume the analyzer's GPIB address is 18:
	SSM "synth test.ssm"          ... Load synth test.ssm for playback
	SSM 18                        ... Begin acquiring data from analyzer at GPIB address 18
	SSM 18 -856xa                 ... Special option required for use with HP8566A-HP8568A models
	SSM 18 -8569b                 ... Special option required for use with HP8569B/8570A
	SSM 18 -358xa                 ... Special option required for use with HP3588A/3589A
	SSM 18 -3585                  ... Special option required for use with HP3585A/B
	SSM 18 -r3261                 ... Special option required for use with Advantest R3261/R3361/R3265/R3271 analyzers
	SSM 18 -advantest             ... Special option required for use with other supported Advantest R3100/R3200/R3400-series analyzers
	SSM 18 -scpi                  ... Special option required for use with Agilent E4400-series, R&S FSE/FSIQ/FSP/FSU, and other SCPI-compatible analyzers
	SSM 18 -nmea:com2             ... Log GPS coordinates from NMEA receiver at COM2
	SSM 18 -pal:"xxx"             ... Specify palette filename (default = COLORS.BIN)
	SSM 18 -interval_ms:1000      ... Specify desired interval between traces recorded to output file, 0=default (record all traces as they arrive)
	SSM 18 -f                     ... Favor speed over resolution or other factors (if supported)
	SSM 18 -F                     ... Run in fullscreen mode
	SSM 18 -m                     ... Enable max-hold in X/Y display
	SSM 18 -trace:"TB"            ... Acquire from specified trace memory (HP 8566B/8568B only, default="TA")
	SSM 18 -M                     ... Enable max-accumulation trace in X/Y display
	SSM 18 -V                     ... Enable average-accumulation trace in X/Y display
	SSM 18 -n:320                 ... Record 320 spectral bins per sweep (instead of 640-bin default)
	SSM 18 -ao:-7                 ... Add -7 dBm to all recorded amplitude values
	SSM 18 -fo:1500000000         ... Add 1.5 GHz to all recorded frequency values
	SSM 18 -cs                    ... Disable color-smoothing in waterfall display
	SSM 18 -t                     ... Disable GPIB timeout checking during long sweeps
	SSM 18 -w                     ... Display WiFi channel boundaries in sweeps containing 2.4 GHz spectrum
	SSM 18 -g                     ... Display GPS L1 channel boundaries in sweeps containing 1575 MHz spectrum
	SSM 18 -i                     ... Display standard Iridium simplex band boundaries in sweeps containing 1626 MHz spectrum
	SSM 18 -I                     ... Display standard Iridium simplex channel markers in sweeps containing 1626 MHz spectrum
	SSM 18 -x -y                  ... Turn off graticule display (-x = X grid, -y = Y grid)
	SSM 18 -spline                ... Resample trace using cubic-spline reconstruction
	SSM 18 -point                 ... Resample trace using point-sampled values
	SSM 18 -max                   ... Resample trace using maximum bin values
	SSM 18 -min                   ... Resample trace using minimum bin values
	SSM 18 -avg                   ... Resample trace using average bin values
	SSM 18 -startup:"xxx"         ... Specify GPIB command string to be issued when connecting for the first time
	SSM 18 -shutdown:"xxx"        ... Specify GPIB command string to be issued when exiting SSM
	SSM 18 -connect:"xxx"         ... Specify GPIB command string to be issued when connecting to instrument
	SSM 18 -disconnect:"xxx"      ... Specify GPIB command string to be issued when disconnecting from instrument
	SSM 18 -856xa -f              ... Example using multiple options

	SSM -sa44                     ... Special option required for use with Signal Hound USB-SA44/B or USB-SA124A.  No GPIB address is needed for this instrument.
	SSM (no filename or address)  ... Open the application in offline mode
For more details on trace resampling, see the FAQ ("How do the trace-resampling options in SATRACE and SSM work?").
Controlling the Spectrum Analyzer
In most cases, SSM does not attempt to control or configure the spectrum analyzer. Traces are acquired based on the current front-panel settings such as center frequency, reference level, resolution bandwidth, and so forth. However, SSM does provide limited control options for certain analyzer models. These options are shown below.-RL:-40 ... Specify reference level in dBm (Signal Hound only, default = -30) -CF:90.3E6 ... Specify center frequency in Hz (Signal Hound and E4406A only, default = 98 MHz; requires -span: option to be specified) -span:10E6 ... Specify span in Hz (Signal Hound and E4406A only, mandatory if -CF option is used) -start:88E6 ... Specify sweep start frequency (Signal Hound and E4406A only, default = 88 MHz) -stop:108E6 ... Specify sweep stop frequency (Signal Hound and E4406A only, default = 108 MHz) -bins:64 ... Specify FFT kernel size (Signal Hound only, default = 128, must be power of 2 between 16 and 256 inclusive) -sens:2 ... Specify sensitivity factor (Signal Hound only, default = 2, range 0-2) -RFATT:10 ... Specify RF attenuation in dB (Signal Hound only, default = 0, range 0-15 dB in steps of 5 dB) -logdiv:10 ... Specify dB/division (Signal Hound only, default = 10) -divs:10 ... Specify # of divisions (Signal Hound only, default = 10)The -CF and -span options take precedence over -start and -stop.
Menu Commands and Keyboard Shortcuts
Key Menu Command Remarks
s File->Save current acquisition to file Saves all recorded data since the beginning of the
acquisition session to an .SSM file
l File->Play recorded data from file Loads an .SSM file and enables the navigation controls
(During playback of a saved .SSM file, you can
also use the up/down arrows, Page Up/Page Down keys,
and Home/End keys to scroll the display.)
File->Export X/Y trace to .CSV file... Saves the trace currently visible in the X/Y graph as a
list of frequency/amplitude pairs in a comma-separated
value (.CSV) file, readable by Excel and other applications.
Values are written as floating-point Hz,dBm pairs.
(Note that you can click on the waterfall display during
playback to recall any recorded trace to the X/Y display for
viewing or exporting.)
e File->Export individual X/Y points to .CSV file...
Same as above, except that each Hz,dBm pair is written to its
own line
S File->Save .BMP, .GIF, .TGA, or .PCX screen shot...
Saves only the current display as a bitmap image.
(Unlike .SSM files, the bitmap file will contain no
historical data other than whatever's displayed on the screen.)
p File->Print screen image Sends the current display to the default Windows printer
File->Load default palette Reloads the default color palette, abandoning any changes made
File->Save default palette Saves the current palette as the default color palette
Esc File->Quit
Points->4 These options adjust the number of visible trace "bins"
Points->16 acquired from the spectrum analyzer. In reality,
Points->64 the analyzer's trace width is device-dependent, and
Points->128 will rarely match any of these options. SSM will resample
Points->320 the physical trace points to the specified number of
Points->640 output bins using the selected resampling algorithm below.
Points->Select minimum When the number of data points available from the analyzer
Points->Select maximum trace is not the same as the number of bins selected above,
Points->Select average these options determine how multiple adjacent trace points
Points->Point-sample contribute to each visible bin. The Min/max/avg options are
Points->Cubic spline meaningful only when the trace width is greater than the
selected number of points. See the FAQ for more information
on trace resampling.
Style->Connected lines These options control the appearance of the X-Y graph
Style->Dots at the bottom of the display.
Style->Bars
Display->Accumulate minimum These options enable and disable various accumulation traces
M Display->Accumulate maximum that can be rendered on the X-Y graph. They have no effect
Display->Accumulate average on the data sent to the rising-raster display.
m Display->X/Y max hold Toggles the max-hold feature on the X-Y graph, clearing any
accumulated data. Has no effect on data sent to the
rising-raster display.
Display->Smooth waterfall colors Enables or disables color interpolation on the rising-raster
graph for amplitude values that fall between palette levels.
When acquiring or playing back sweeps with wide dynamic range,
small changes in signal levels may be more easily spotted
with this option enabled.
x Display->Graticule X Toggles graticule lines on the X-Y graph
y Display->Graticule Y
w Display->802.11 WLAN channel boundaries Toggles vertical frequency masks at channels 1, 6, and 11
in the 2.4-GHz WiFi band
g Display->GPS channel boundaries Toggles vertical frequency mask for major lobes in L1 GPS
allocation (1575.42 MHz +/- 1 MHz)
i Display->Iridium simplex band limits Toggles vertical frequency mask for standard Iridium simplex band
(1626.0 - 1626.5 MHz)
I Display->Iridium simplex channels Toggles frequency markers for standard Iridium simplex channels
Display->Show frame rate Toggles frames-per-second display
Measure->Apply cursor thresholds Causes SSM to clip data from the X/Y graph against the
Y-threshold cursors before sending it to the rising-raster
display. When this option is turned off, the cursors serve
only as markers.
o Measure->Edit frequency and amplitude offsets...
Allows you to specify correction factors to be added to all frequency
and amplitude values recorded by SSM. Typical uses include compensating
for external preamplifiers and downconverters.
r Measure->Edit composite sweep range...
Allows sweeps to be generated by combining multiple spans acquired
from certain instruments (currently limited to the Agilent E4406A.)
Without this feature, the E4406A is limited to 10 MHz spans.
F5 Display->Recompose display In playback mode, forces SSM to reload the current file and
scroll it onto the waterfall display. This can be helpful
after changing the accumulation or threshold-cursor options,
since they are not automatically applied to existing data
in the display.
Alt-Enter Display->Toggle fullscreen mode Switches between fullscreen and window mode. Fullscreen mode
may be faster on some PCs, but the menu bar at top will not
be visible unless the mouse cursor is moved to the top of the
screen. Fullscreen mode is not recommended if you use a software
mouse cursor.
Space Acquire->Stop/restart acquisition This command causes SSM to toggle its GPIB connection to the
spectrum analyzer, allowing you to control the analyzer from
its front panel. Upon (re)starting, any existing data in the
session.ssm temporary file will be overwritten with
incoming trace data. If no GPIB connection has been established by
use of the Acquire options below, an internally-simulated
test signal will be rendered.
Scroll Lock Acquire->Pause/resume acquisition This command can be used to stop recording new traces while
remaining connected to the spectrum analyzer. Upon resuming,
SSM will continue adding traces to the session.ssm recording in progress.
The spectrum analyzer will continue to sweep under program control
while the measurement is paused, with its front-panel controls locked out.
Acquire->Acquire data from supported device These commands cause SSM to look for a supported spectrum analyzer
at the specified GPIB address and begin acquiring data from it.
Current supported models are listed in the table at the beginning of
this file.
Acquire->Acquire data from Signal Hound This command causes SSM to attempt to connect to a USB-SA44/B or
USB-SA124A Signal Hound spectrum analyzer.
Acquire->HP 8566A/8567A/8568A mode This option MUST be selected prior to your first attempt to
connect to an HP 8566A, 8567A, or 8568A spectrum analyzer.
(Alternatively, the -856xa option may be used on the SSM.EXE command line.)
This is necessary because these analyzers cannot be identified
automatically by SSM.EXE, and because their GPIB implementations
are significantly different from the later B-series models.
Acquire->HP 3585A/B mode This option MUST be selected prior to your first attempt to
connect to an HP 3585A or HP 3585B spectrum analyzer.
(Alternatively, the -3585 option may be used on the SSM.EXE command line.)
Acquire->HP 3588A/3589A mode This option MUST be selected prior to your first attempt to
connect to an HP 3588A or 3589A spectrum analyzer.
(Alternatively, the -358xa option may be used on the SSM.EXE command line.)
Acquire->HP 8569B/8570A mode This option MUST be selected prior to your first attempt to
connect to an HP 8569B or HP 8570A spectrum analyzer.
(Alternatively, the -8569b option may be used on the SSM.EXE command line.)
Acquire->Advantest R3261/R3361/R3265/R3271 mode
This option MUST be selected prior to your first attempt to
connect to an Advantest R3261/R3361-series spectrum analyzer,
including the R3265 and R3271 models.
(Alternatively, the -r3261 option may be used on the SSM.EXE command line.)
Acquire->Advantest R3100/R3200/R3400 mode This option MUST be selected prior to your first attempt to
connect to all other supported Advantest spectrum analyzers.
(Alternatively, the -advantest option may be used on the SSM.EXE
command line.) See the instrument list at the top of this page for the
supported Advantest models.
Acquire->SCPI-compatible analyzer mode This option MUST be selected prior to your first attempt to
connect to an Agilent E4400-series, FieldFox, N9010B, R&S FSEx/FSIQ/FSP/FSU, or other
SCPI-compatible spectrum analyzer that's not supported by a more specific menu option.
(Alternatively, the -scpi option may be used on the SSM.EXE command line.)
Acquire->Acquire at maximum available speed
This option can be selected to improve acquisition speed on some instruments
by acquiring fewer data points per sweep, reducing the resolution of the
collected data, disabling the front-panel display, or other actions. It's disabled
by default unless you use the -f (fast acquisition) option on the SSM.EXE command line.
Keyboard-Only Controls
     A/Z               Adjusts the border between X/Y and rising-raster display.  Usable only when not acquiring data.

     G/H               Save your CRT! During acquisition from the HP 8566/8567/8568 analyzers, you can turn the
                       analyzer's CRT power supply off and on at any time by pressing the uppercase G and H keys,
                       respectively.  These keys correspond to the Shift-G and Shift-H commands available via the
                       85662A display's front panel.

                       HP analyzer CRTs tend to age by cathode poisoning.  Turning down the Intensity control during
                       unattended operation will prevent phosphor burn-in, but it will not necessarily extend the useful
                       life of your CRT!  The G/H commands will.

                       On Tektronix 490, 2750, and 2710-series analyzers, these commands will blank and unblank the CRT text readout.
                       If you plan to use SSM on Tek 490/2750-series instruments, consider applying this modification to allow
                       the READOUT button to blank the entire CRT.

     Up/down arrows    Scroll the rising-raster display up or down one row at a time when playing back a recording.
     PgUp / PgDn       Scroll the rising-raster display up or down several rows at a time.
     Home / End        Scroll to the beginning or end of the recorded data.
Threshold Cursor Controls
Two purple horizontal-line cursors in the X/Y display serve as handy amplitude-measurement markers.
Optionally, when the Measure->Apply cursor thresholds option is selected, the cursors can be used to exclude data within a given amplitude range from the rising-raster display. In this mode, when the solid cursor is above the broken cursor, values that are below the solid line and above the broken line will be displayed. Otherwise, if the solid cursor is below the broken cursor, values that fall between the two cursors will be excluded. This feature can be helpful when you need to identify amplitude values that fall either outside, or within, certain limits. (All incoming data is still recorded; the cursor thresholds affect only the appearance of each row as it scrolls onto the rising-raster display.)
It's easier to adjust the cursors if you pause data acquisition (Space bar or Acquire->Stop/restart) first.
Editing the Color Palette
When you left-click any of the color palette blocks next to the rising-raster display, a color-selection dialog box will appear. Any changes you make to the selected color will be copied to the palette block entry.
Normally, you'll use this feature to assign colors to the maximum and minimum amplitudes in a particular range of interest, then create a "gradient" in the palette by left-clicking the entry at one end of the desired range and dragging the mouse cursor to the other before releasing the left button. When you do this, SSM will automatically fill the intervening palette entries with linearly-interpolated color values. You can spread out all of the colors in the palette this way, or create separate gradients between as many color pairs as you like.
Changes to the palette will be saved with any current or future recording made in the session. You can also select File->Save default palette to write your changes to the default SSM palette file, or use File->Load default palette to roll back any changes you've made.
As with other mouse-oriented controls, it's much easier to edit palette colors and gradients if you pause the data-acquisition process first.
CONNECT.INI
Your PC should also contain a file called CONNECT.INI, which tells the GPIB Toolkit how to take advantage of various GPIB connectivity options. These include direct RS-232 or TCP/IP links, as well as the Prologix GPIB-USB and GPIB-ETHERNET adapters.
If you have a Prologix adapter, you can review the comments in CONNECT.INI to learn how to configure SSM and the other GPIB Toolkit applications to use it, or you can simply select your adapter in the Prologix configurator application (PROLOGIX.EXE) and press "Update CONNECT.INI" to automate the configuration process.
If the COM port specification in CONNECT.INI is commented out with a leading semicolon -- or if CONNECT.INI is missing entirely -- all GPIB Toolkit applications will attempt to communicate with the GPIB0 device via the National Instruments NI488.2 programming interface instead. This is the default behavior.
Note that some versions of Windows hide .INI file suffixes by default. In Windows 2000 and XP, for instance, CONNECT.INI may appear simply as "CONNECT," with the type "Configuration Settings." To turn off this behavior, go to the Tools->Folder Options->View tab in any Explorer window and deselect the "Hide file extensions for known file types" option. The exact location of CONNECT.INI will vary from one Windows installation to the next. It's often easier to select the "Edit CONNECT.INI" button in the GPIB configurator application than to try to locate the file yourself.
Instrument Configuration Notes
The default GPIB address for many of the HP analyzers supported by SSM.EXE is 18.
Note that if you are using a Tektronix 490P/2750P analyzer, you must set the rear-panel LF-or-EOI switch to '1' for use with the GPIB Toolkit applications. You may also need to disable the Acquire->Acquire at maximum available resolution feature (or use the -f command-line option) for compatibility with older Tektronix 492P/496P models.
If your analyzer is an HP 8566A, 8567A, or 8568A, you must select the Acquire->HP 8566A/8567A/8568A mode menu option before trying to connect to the instrument. Similarly, the Acquire->HP 8569B/8570A mode menu option enables support for the HP 8569B/8570A, while Acquire->HP 3588A/3589A mode enables support for the HP 3588A and HP 3589A analyzers. Acquire->HP 3585A/B mode should be selected prior to connecting to an HP 3585A or HP 3585B.
Advantest R3261, R3361, R3265, and R3271 users must select Acquire->Advantest R3261/R3361/R3265/R3271 mode prior to connection. If you are using any other member of the Advantest R3100/R3200/R3400 families, you'll need to select Acquire->Advantest R3100/R3200/R3400 mode instead.
If you are using a newer SCPI-compliant analyzer model such as the Agilent E4400 series or Rohde & Schwarz FSEA/B/M/K, FSIQ, FSP, or FSU, you'll need to select Acquire->SCPI-compatible analyzer mode. This is also true for certain IEEE 488.2-compliant instruments that aren't compatible with the Agilent E4400 SCPI implementation, such as the Anritsu MS8604A and MS2650/MS2660 series.
Note that many newer analyzers have multiple modes and trace options that may need to be disabled. SSM expects the instrument to be configured in spectrum analyzer mode with the factory-default trace width/point count. If the instrument is set up as a network analyzer or cellular service monitor, compatibility issues can be expected.
Finally, if you want to place the GPIB address on the command line when using an analyzer model with its own Acquire menu entry, you'll need to use the equivalent -856xa, -8569b, -3585, -358xa, -r3261, -advantest, or -scpi command-line option (e.g., c:\>ssm 18 -8569b.)
Release Notes
Release 1.00 of 13-Dec-05
Release 1.01 of 28-Dec-05
Acknowledgements and Additional Notes
The assistance (and patience) of Dave Robinson, WW2R is gratefully acknowledged.
Thanks to Geoff Bunza, AD7JP for the Tektronix 2710-series patch.
Thanks to Dr. Alfredo Rosati, I5UXJ for his contribution of the Tektronix 2782/2784 support code, to Ron Kittel, K8AQC, and Grant Hodgman, G8UBN for their extensive help with development and testing on the HP 3585A. Matt Ettus of Ettus Research provided access to the Advantest R3267, and Jack Smith, K8ZOA of Clifton Laboratories provided access to the Advantest R3463. Darren Storer, G7LWT provided access to the Advantest R3361A, while Dimitry Borzenko, 4Z5CP, provided access to the Anritsu MS8604A.
The assistance of Had Allhands, K7MLR with the HP 3588A, and of Abdul Nizar of Synapse Product Development with the Agilent E4402B, is greatly appreciated.
Source code compilable with the free Microsoft Visual Studio Express package
No warranties, expressed or implied, are offered with this program.
Use at your own risk!